Sunday, March 31, 2013

OBIEE 11g: Adding Sequence ROW_ID to Keep Track of "# Rows"

When looking at big data, it makes it easier if we have ROW # to help us navigate throughout. Especially if we were to reference it, similar to MS Excel - where it is built in to reference to every cell.

To apply sequence # in OBIEE, please follow below steps:

1. Add a column from Subject Area and Edit Formula:
2. Replace column's formula with: RCOUNT(1)


3. Add all other necessary report columns and click on Results
4. Result:

Hope this helped!

OBIEE 11g: Freeze Column Headers in OBIEE 11.1.1.6.x

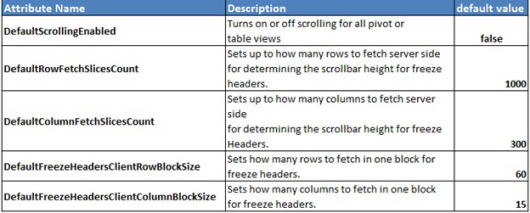
Another useful feature enabled in OBIEE 11.1.1.6.x is to be able to freeze column headers, similar to MS Excel’s – Freeze Panes; which makes it easier.

The default Freeze option is disabled; to turn ON this feature please follow below steps:

1. Stop the Presentation Services

2. Open instanceconfig.xml (file path: <MiddlewareHome>\instances\instance2\config\OracleBIPresentationServicesComponent\coreapplication_obips1)

3. Locate closing tag for </Views>; which should be at the end of the file.

4. Add below entry before </Views> and save:
<GridViews>
<DefaultScrollingEnabled>true</DefaultScrollingEnabled>
<DefaultRowFetchSlicesCount>200</DefaultRowFetchSlicesCount>
<DefaultColumnFetchSlicesCount>300</DefaultColumnFetchSlicesCount>
<DefaultFreezeHeadersClientRowBlockSize>60</DefaultFreezeHeadersClientRowBlockSize>
<DefaultFreezeHeadersClientColumnBlockSize>15</DefaultFreezeHeadersClientColumnBlockSize>
</GridViews>

Note: Above entry freeze column header option is enabled when number of rows is greater than 200. You can specify the number of rows as you desire.

5. Save the file and start the Presentation Services.

6. This is how table/pivot should look like:
     
Since the Freeze Column option is enabled, it displays “Get more rows” to get more rows:


Hope this helped!

Wednesday, March 27, 2013

Reward for good work

"The reward for good work is more work!" :)

Personal note:
 "The more the work is, the more ambitious I get!"

"I could write..."

"I could write shorter sermons, but once I start, I get too lazy to stop." From movie: Lincoln  (2013)

Saturday, March 23, 2013

OBIEE 11g: Updating Presentation Layer Permission for all Columns in RPD (.rpd)

So far I have not been able to find an easiest way of changing permissions in the RPD for all columns; as you know setting the permission for the presentation table does not mean that all columns will have the same security level. Below is the easiest way I found:

1. Copy all Presentation Tables from Presentation Subject Area.
   

2. Paste it in universal editor (i.e. Notepad++); Notice that it has privilege settings for all columns:
    
  
3. Now you can replace current privileges with one of the available options: READ, READ_WRITE, NONE and vice versa.
4. Once done, copy from editor and paste directly into the subject area
      a. Note: this will create duplicate presentation tables with #1 at the end of the table name(s).
          
5. Delete original presentation tables and delete #1 from pasted table names.
      a. Note: Column names do not change, only presentation table name changes alone.

If anyone has an alternative solution, please share! :)

Hope this helped!

Thursday, March 21, 2013

OBIEE 11g: Alternative Dashboard "Reset" Button

As we know OBIEE's dashboard prompt's "Reset" button clears selection only for active selection before clicking "Apply;" however, once a filter has been applied, "Reset" button should clear previous selections, and currently OBIEE's "Reset" button DOES NOT do that. So here is a solution:

  1. Add Text in Dashboard's Edit mode.
  2. Paste below code as an extra button that clears applied dashboard prompts:
  3. You can rename bolded "Clear Selection" inside the code if you would like to call it something else.
Hope this helped!


OBIEE 11g: Using FILTER Function Instead of CASE Statements

It is well-known that CASE statements are notorious for causing poor query performance; and an alternative performance-friendly function, FILTER, can be used instead. In the Expression Builder, this function can be found under Functions > Display Functions > Filter. Here is an example of how to use it:

Assuming there are two Logical Columns derived from the following expressions:
  • Southern Region Units: 
    CASE WHEN Paint.Markets.Region = ‘SOUTHERN REGION’ THEN Paint. SalesFacts.Units ELSE 0 END
  • Western Region Units:
    CASE WHEN Paint.Markets.Region = ‘WESTERN REGION’ THEN Paint. SalesFacts.Units ELSE 0 END
An equivalent FILTER expression:
  • Southern Region Units:
    FILTER(Paint. SalesFacts.Units USING Paint.Markets.Region = ‘SOUTHERN REGION’)
  • Western Region Units:
    FILTER(Paint. SalesFacts.Units USING Paint.Markets.Region = ‘WESTERN REGION’)
COMPARISON:
CASE generated query (assuming all columns come from the same table): 
SELECT Year,
SUM(CASE WHEN Region = ‘SOUTHERN REGION’ THEN Units ELSE 0),
SUM(CASE WHEN product = ‘WESTERN REGION’ THEN Units ELSE 0)
FROM physical_table
GROUP BY year

FILTER generated query:
SELECT Year,
SUM(CASE WHEN Region = ‘SOUTHERN REGION’ THEN Units),
SUM(CASE WHEN product = ‘WESTERN REGION’ THEN Units)
FROM physical_table
WHERE Region = ‘SOUTHERN REGION’ OR Region = ‘WESTERN REGION’
GROUP BY year

The major difference is in FILTER query's WHERE clause, which gets executed first at the database level; where for CASE query, it executes line-by-line, which impacts the performance dramatically.

Hope this helped!

Friday, March 15, 2013

Manual Data-Load made easy from MS Excel to SQL Developer

If you would like to load a sample data into a database the most efficient way possible, here is how:

1. Open your excel source file and first UPPERCASE all column headings by replacing space (“ “) with underscore (“_”) for all columns. Since database columns have to be in uppercase for easy to query, otherwise SQL Developer will put quotation for lowercase column heading names. 

=UPPER(SUBSTITUE(A2," ", "_"))
UPPER - will capitalize the letters
SUBSTITUTE - will replace space (" ") with underscore ("_")


2. Save the excel data as .csv file and import into SQL Developer.
3. Right click into Tables > Import Data... and follow the instructions.


Hope this helped!

Saturday, March 9, 2013

OBIEE 11g: Displaying / Calculating "Grand Total" in Table-view BEFORE Values

Currently OBIEE 11g does not have an option to show Grand Total “Before” values like it does in Pivot-table view.
     vs.

In order to show Grand Total before values in table-view, follow these steps:

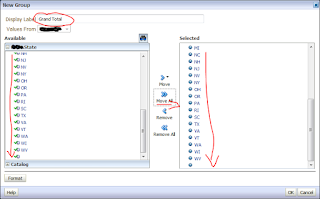
1. Create new group from Selection Steps:


2. Specify Display Label: Grand Total (or whatever you would like to call the Grand Total) and click OK.


3. Click on newly created group and click “Save Group As…” and save in recommended path; otherwise you cannot add it later.


4. Delete the new group from selection steps and edit Start with all members:


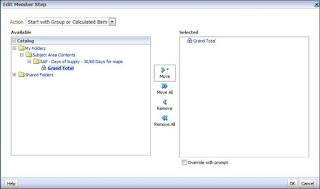
5. In “Edit Member Step” set the Action to “Start with Group or Calculated Item”
6. Navigate to where you saved the new Group and add it in:


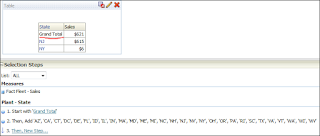
7. Notice in table-view, you will see only Grand Total now:


8. In selection step, click on Then, New Step > Select Members and add all available members and click OK:


9. Since I have data only for New Jersey and New York state, it shows the total for those states.

Hope it helped!

Identifying USB 2.0 vs. 3.0

Normally new USB 3.0 is colored as blue; however, there are some USB ports that are USB 3.0 but in black. And the difference between the two is in the number of teeth it has.

USB 2.0 has 4 teeth:


USB 3.0 has 5 teeth:


Hope it helped!

Sunday, March 3, 2013

OBIEE 11g: Switching between Multiple Reports using Presentation Variable

Dashboard prompts are used for filtering data values in reports, but here is one more functionality of dashboard prompt that is, you can also use it to switch between multiple reports. I will show switching between reports without using any intermediate report. So I am using 3 reports which I want to switch using dashboard prompt which are Analysis A, Analysis B, and Analysis C. Here is an example along with the steps:

Ø  Step I: Create a Dashboard Prompt with the intended reports as a data value (Analysis A, Analysis B, and Analysis C) to be selected. 

1. Click on New->Dashboard Prompt->select any subject area.

Note: It will not affect on our dashboard prompt as we have to create presentation variable of our choice.

2. Definition Pane for dashboard prompt will open. Now select "Variable Prompt" as below.


3. Now "New Prompt" dialogue will open. Create presentation variable as PV,label it as Select Report  and select User Input as Choice List.


4. In Choice list Values click on plus (Green Icon) sign; it will display "Enter New Value" dialogue. Now manually enter the names of the reports which you want to display in prompt. Here I will put my three report names which I want to display as a list in dashboard prompt which are Analysis A, Analysis B, and Analysis C as below :


5. Now expand the Options. In "Default Selection" you can give any report name which you want to display by default on dashboard by selecting that report name as "Specific Custom Value". Here I have given "Analysis A" as my default selection.


6. Now save your dashboard prompt. In this way our dashboard prompt is ready from selecting reports which will look like :


Ø  Step II: Create reports which you want to display according to selected report name in dashboard prompt.

Now I will create three reports named Analysis A, Analysis B, and Analysis C and will apply some filters in theses individual reports which will allow me to show the intended report as per selection made in dashboard prompt. So let's create "Analysis A" 
 1.  I am taking some columns in reports plus one dummy column. I have change the column formula of Dummy column as:
CASE '@{PV}' WHEN 'Analysis A' THEN '1' ELSE '0' END

 
2. Now I have applied filter on Dummy Column as "is not equal to /is not in" '0'.
3. After changing column formula of Dummy Column and applying filter I have hide the dummy column by clicking on Column Properties > Column Format > Checked "Hide" checkbox. We can also delete the Dummy Column but make sure filter on that dummy column is important. Follow the same process in the rest two reports by slightly changing its column formula and filter based on the reports.
 
4. In "Analysis B" I have changed the column formula of Dummy Column and applied filter as :

CASE '@{PV}' WHEN 'Analysis B' THEN '1' ELSE '0' END

5. In "Analysis C" I have changed the column formula of Dummy Column and applied filter as:

CASE '@{PV}' WHEN 'Analysis C' THEN '1' ELSE '0' END


In this way we have done with creating all the three reports with intended filters.

Ø  Step 3: Putting dashboard prompt and three reports in Dashboard by applying certain conditions on each sections in "Edit Dashboard".

1. In "Edit Dashboard" I am first putting dashboard prompt and then all the three reports as below:


Note: Put all the reports and dashboard prompt in separate sections as we have to apply the condition on section.

  2. Now I am applying condition in section of "Analysis A"  by clicking on Properties > Condition > Section Condition as below :


3. For the section of "Analysis B" I am defining condition as: 


4. And finally for the section of "Analysis C" I am defining condition as: 


5. Now save your dashboard page and run it. 

6. Here "Analysis A"is my default report so it is visible on my dashboard by default. Now whatever options (report name) you will select from prompt those report will be shown. It is not necessary to show one default report; you can remove default selection from dashboard prompt. 

7. It will work as :